Digital Elevation Models
Digital Elevation Models
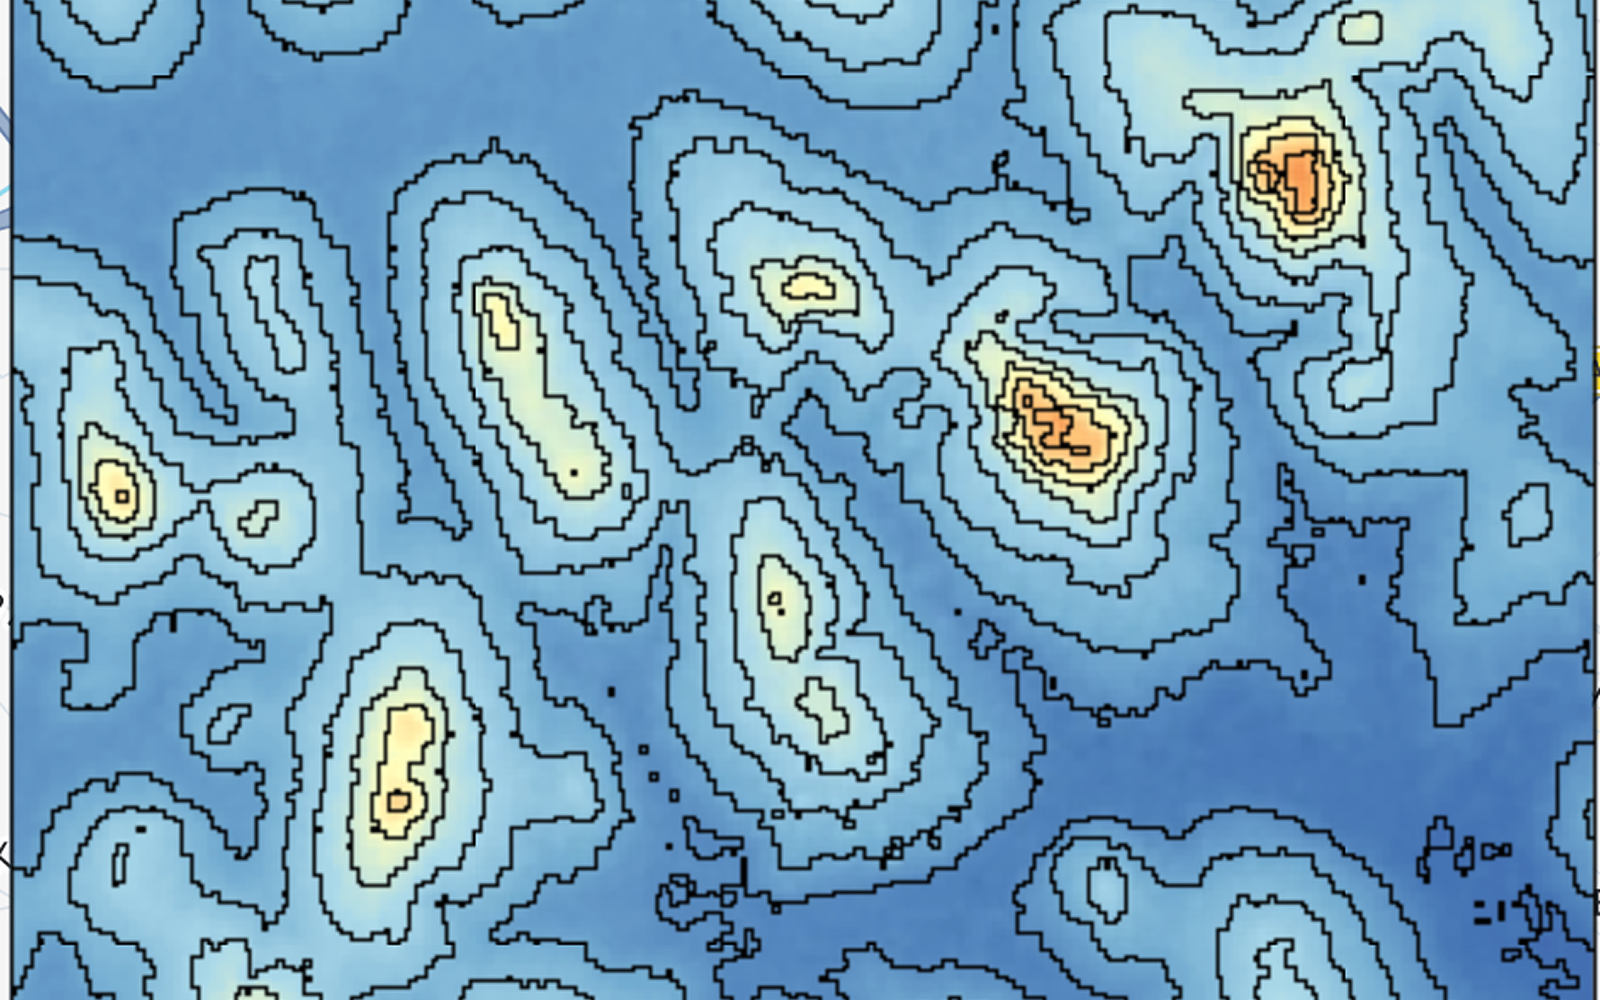
Imagine having a digital map that shows the elevation at every point across a landscape. That is essentially what a Digital Elevation Model (DEM) provides.
A DEM is a digital representation of Earth’s surface elevation. Elevation data can be collected in several ways, including ground-based topographic surveys, Global Navigation Satellite System (GNSS) positioning, photogrammetry, laser altimetry, satellite radar, and digitised topographic contours.
In GIS, a DEM is commonly represented as a raster grid, where each cell contains an elevation value, typically measured in metres above a reference level such as mean sea level. Because elevation is represented as a continuous surface, DEMs are particularly useful for analysing processes that are influenced by terrain.
From forestry and agriculture to hydrology, urban planning, and energy development, DEMs help us understand landscapes and assess potential risks before they become problems.
If you are new to raster data, see my previous post on Raster Data.
Types of Elevation Models
Elevation models can be generated from different remote sensing and surveying techniques. Depending on what is represented, they can describe the Earth’s surface, including natural and human-made features, or attempt to represent the underlying bare terrain.
The two commonly discussed types are Digital Surface Models (DSM) and Digital Terrain Models (DTM).
Digital Surface Model (DSM)
A Digital Surface Model represents the elevation of the Earth’s surface including objects on it, such as buildings, trees, and other vegetation.
For example, in an urban area, a DSM can show the height of buildings in addition to the underlying terrain.
DSMs are useful for:
- Urban planning and development
- Vegetation and forest analysis
- Building height estimation
- Telecommunications and line-of-sight analysis
- Orthorectification of satellite and aerial imagery
Digital Terrain Model (DTM)
A Digital Terrain Model attempts to represent the bare-earth surface, excluding features such as buildings and vegetation.
DTMs are particularly useful when the shape of the underlying terrain is more important than the objects covering it.
Common applications include:
- Terrain analysis
- Hydrological modelling
- Flood and drainage analysis
- Geomorphological studies
- Geodesy and geophysical applications
A DTM can sometimes be derived from elevation data that initially contains surface features, such as a DSM, through filtering and classification techniques.
Hybrid Elevation Models
Some elevation products combine characteristics of surface and terrain models. These products may smooth or remove smaller objects while retaining larger terrain and vegetation features.
Depending on how they are generated, such models can be useful for applications such as:
- Orthorectification
- Terrain modelling
- Environmental monitoring
- Cartographic mapping
It is important to check the methodology behind an elevation product rather than assuming that all “hybrid” models represent the same type of surface.
Resolution and Accuracy
Two concepts are particularly important when working with DEMs: spatial resolution and accuracy.
Spatial Resolution
Spatial resolution describes the size of each raster cell.
For example:
- 30 m: each cell represents approximately 30 × 30 metres on the ground.
- 10 m: provides more spatial detail.
- 1 km: represents a much more generalised surface.
Higher spatial resolution allows smaller terrain features to be represented, but it also increases file size and processing requirements.
However, higher resolution does not automatically mean higher accuracy. A 10-metre DEM can contain larger elevation errors than a 30-metre DEM depending on how the data was collected and processed.
Therefore, when selecting a DEM, it is important to consider both resolution and vertical accuracy.
How Are DEMs Used?
The value of a DEM comes from what we can derive from it.
1. Terrain Analysis
DEM data can be used to calculate terrain characteristics such as:
- Slope
- Aspect
- Curvature
- Hillshade
- Elevation profiles
These measurements help us understand the shape and orientation of a landscape.
2. Hydrology
Elevation strongly influences how water moves across a landscape. DEMs can therefore be used to:
- Identify drainage networks
- Delineate watersheds and catchments
- Model surface runoff
- Identify flow accumulation areas
- Assess potential flood-prone areas
3. Urban Planning
In cities, elevation data can help planners understand how terrain affects buildings, roads, drainage systems, and other infrastructure.
High-resolution elevation data can also support applications such as building-height analysis and urban surface modelling.
4. Ecology and Environmental Monitoring
Terrain influences vegetation, habitats, water movement, and other ecological processes. DEMs can therefore be combined with other environmental datasets to study how landscape characteristics affect ecosystems.
5. Road and Infrastructure Design
Elevation data can help identify suitable routes for roads and other infrastructure while considering changes in terrain.
Instead of manually inspecting an entire landscape, engineers and planners can use terrain models to compare possible routes and identify areas with steep slopes or difficult terrain.
Common DEM Analysis Techniques
Once a DEM is available, several analyses can be performed.
Hillshading
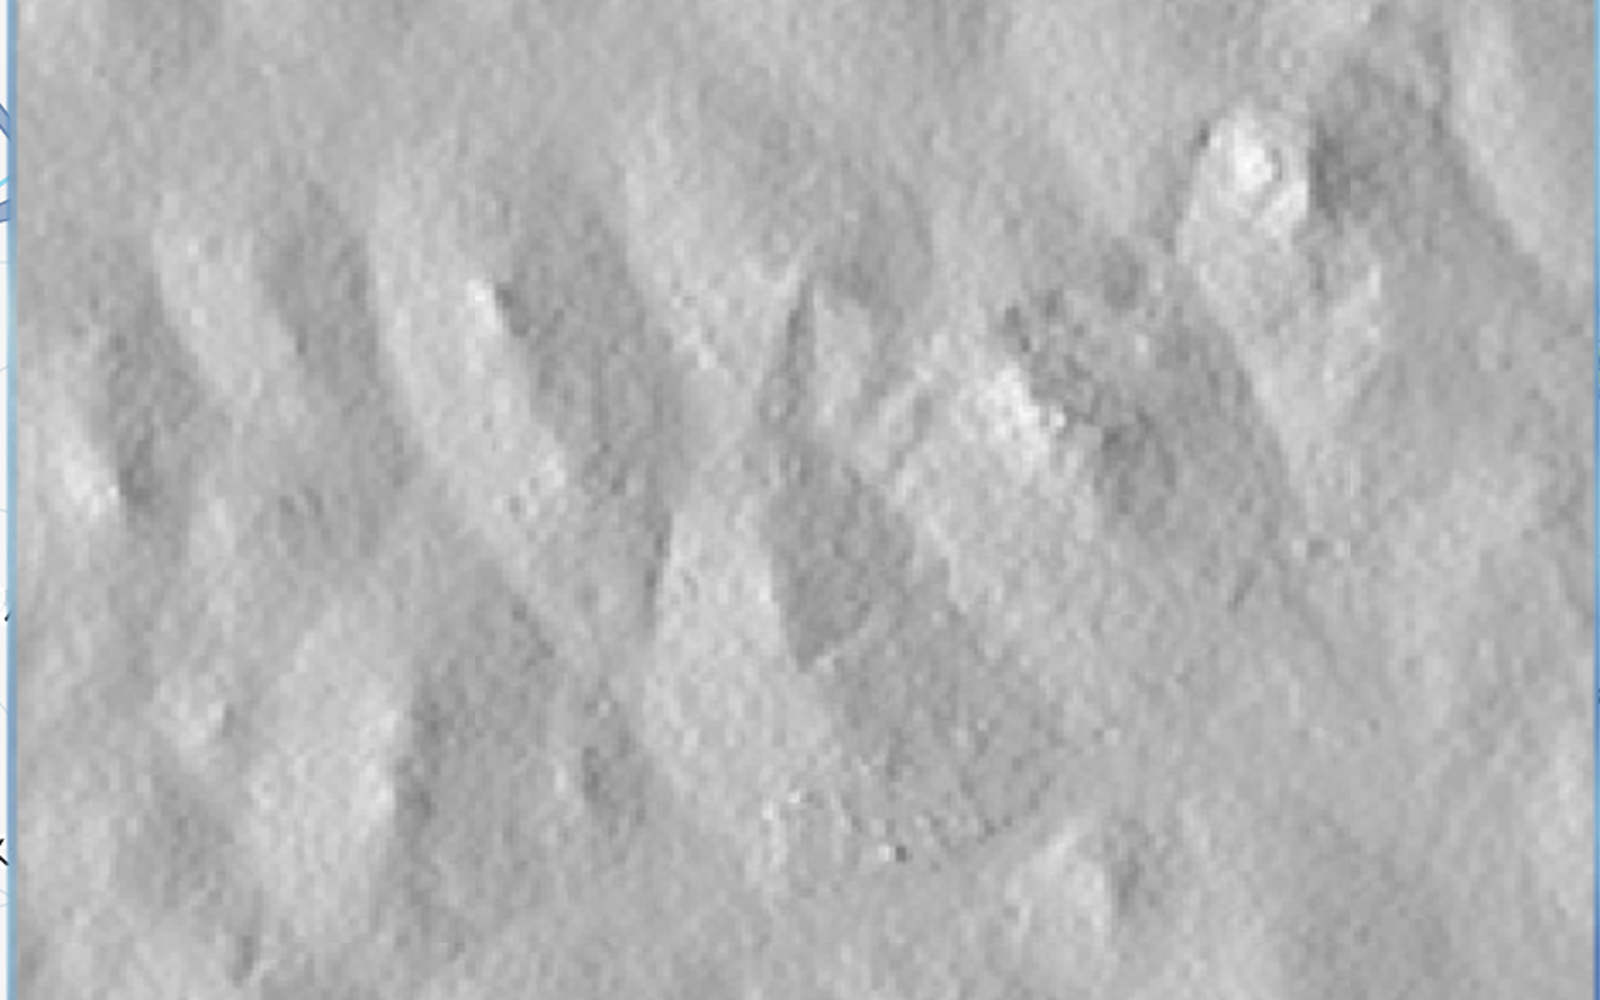
Hillshade creates a three-dimensional-looking representation of terrain by simulating how light falls across the surface.
It is primarily a visualisation technique. It makes features such as ridges, valleys, and depressions easier to see on a map.
Slope
Slope measures how steep the terrain is at each location. It is commonly used in hydrology, agriculture, landslide assessment, and infrastructure planning.
Aspect
Aspect describes the direction that a slope faces. It can be useful for understanding sunlight exposure, vegetation patterns, and surface processes.
Contours
Contour lines connect locations with the same elevation. They provide another way of visualizing changes in terrain and are commonly used in topographic mapping.
What Does a DEM Look Like?
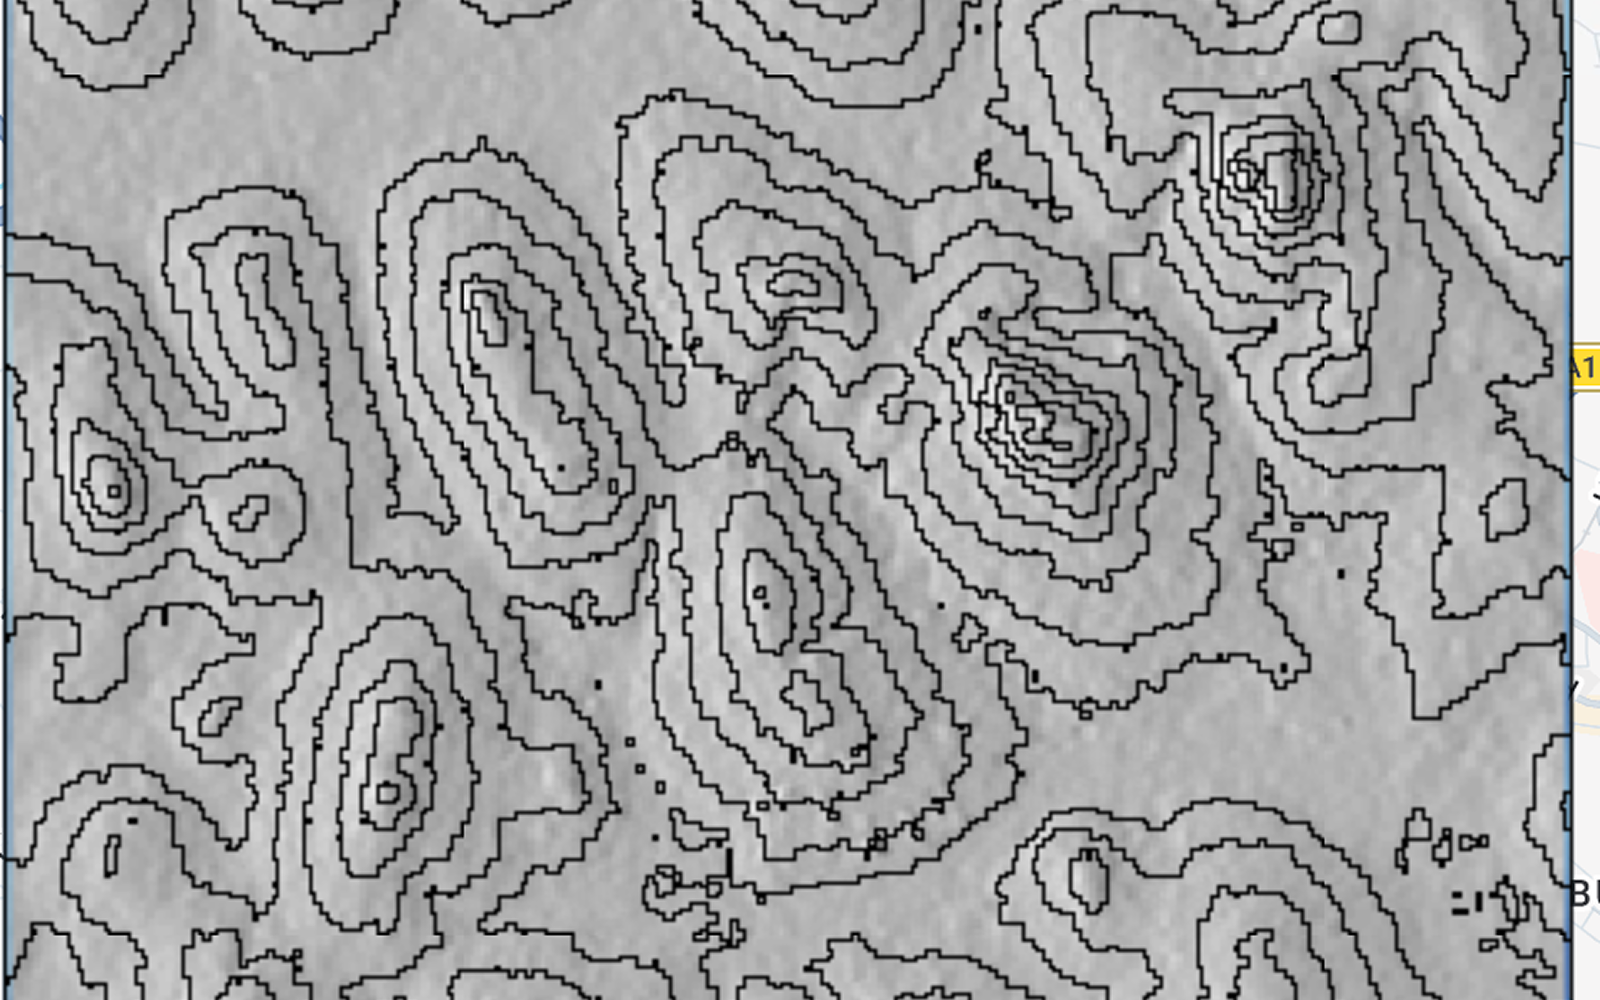
A DEM can be visualized in several ways.
Raster grid:
A grid where every cell contains an elevation value.
Elevation heatmap:
Different colours represent different elevation ranges, making high and low areas easy to distinguish.
Contour map:
Lines connect locations with equal elevation.
3D terrain:
The elevation values are used to create a three-dimensional representation where valleys, ridges, and plateaus become visible.
These are different ways of visualising the same underlying elevation data.
Sources of DEM Data
There are many sources of elevation data, ranging from freely available global datasets to high-resolution commercial products.
The choice of DEM depends on several factors, including:
- Spatial resolution
- Geographic coverage
- Vertical accuracy
- Data acquisition method
- Whether it represents the surface or bare terrain
- Cost and licensing restrictions
Some widely used elevation datasets include:
SRTM
The Shuttle Radar Topography Mission (SRTM) produced one of the most widely used global elevation datasets. The commonly used SRTM product has approximately 30-metre spatial resolution and provides coverage across most of the world’s land surface.
Copernicus DEM
The Copernicus DEM provides global elevation data at different resolutions, including a widely used 30-metre product. It is derived primarily from radar data and is generally considered a Digital Surface Model because it can include features such as buildings and vegetation.
ASTER GDEM
The ASTER Global Digital Elevation Model (GDEM) is another global elevation dataset derived from satellite imagery. It has approximately 30-metre spatial resolution.
FABDEM
FABDEM (Forest And Buildings removed DEM) is a global elevation dataset derived from Copernicus DEM in which estimated building and tree-height effects have been removed. It is therefore useful when a bare-earth representation is required for global-scale analysis.
NASA Earthdata
NASA provides access to several elevation and Earth observation datasets through NASA Earthdata, including products that can be used for terrain and elevation analysis.
Commercial Products
Commercial datasets can provide higher resolution or specialised elevation information for specific applications. Examples include products such as WorldDEM, WorldDEM Neo, and WorldDEM4Ortho.
The appropriate dataset depends on the scale and purpose of the analysis. A global 30-metre DEM may be sufficient for regional hydrological analysis, while engineering or detailed urban applications may require much finer-resolution elevation data.
Where Is DEM Technology Heading?
Elevation data is becoming increasingly detailed as new remote sensing technologies become available.
LiDAR is particularly important because it can produce very high-resolution elevation data and, in many applications, can distinguish between the ground and objects such as vegetation and buildings.
Another important direction is the integration of DEMs with other Earth observation datasets. Combining elevation with satellite imagery, land cover, climate, hydrological, and other geospatial data allows researchers to study environmental processes from multiple perspectives.
As computing capabilities improve, processing large elevation datasets is also becoming more accessible, enabling more detailed and large-scale terrain analysis.
Limitations of DEMs
Despite their usefulness, DEMs are not perfect.
Data gaps and terrain challenges
Some elevation datasets can have gaps or reduced accuracy in areas with dense forests, very steep terrain, water surfaces, or other challenging conditions.
Accuracy depends on the data source
Different technologies have different strengths and limitations. LiDAR, radar, photogrammetry, and satellite-derived elevation models can produce different results for the same area.
Resolution matters
A DEM with coarse resolution may not capture small terrain features. For example, a 1-km DEM may be useful for regional analysis but unsuitable for detailed urban drainage or engineering applications.
Landscapes change
A DEM represents conditions at the time the data was collected. New buildings, roads, mining activities, erosion, landslides, and other landscape changes can make an older DEM less representative of current conditions.
This is why the age of the dataset can be just as important as its resolution when working on dynamic landscapes.
Final Thoughts
A Digital Elevation Model is more than just a map of height. It provides a digital representation of the Earth’s terrain that can be used to understand how landscapes influence water, ecosystems, infrastructure, and human activities.
From a simple raster of elevation values, we can derive slope, aspect, drainage networks, watersheds, and many other terrain characteristics.
The key is choosing the right elevation dataset for the problem. Resolution, accuracy, coverage, acquisition method, surface type, and data age all matter.
And when combined with other Earth observation data, DEMs become a powerful foundation for understanding our changing environment.