Understanding Raster Data: The Foundation of Remote Sensing and GIS
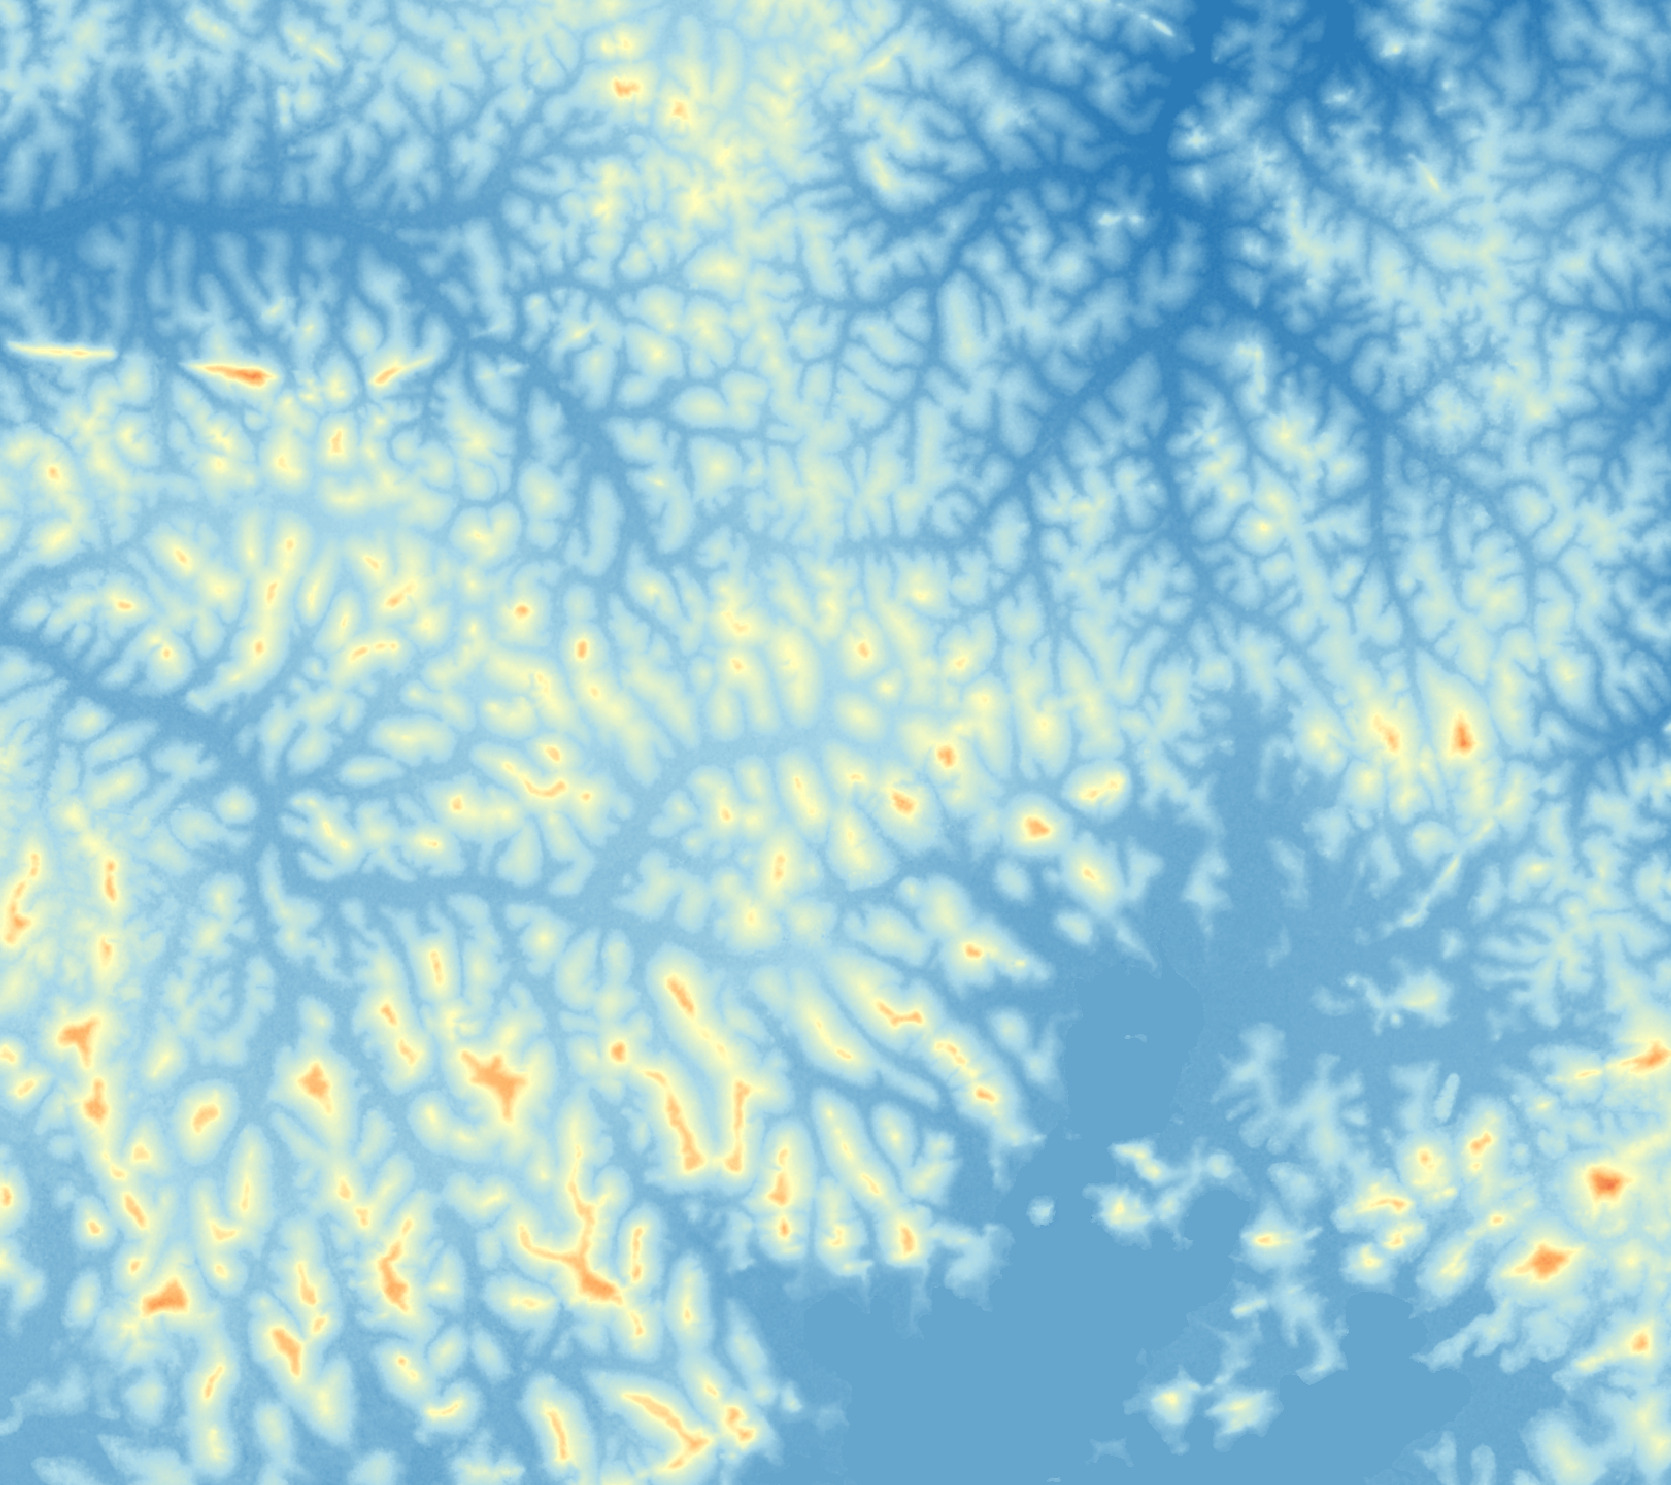 One of the reasons I enjoy working with remote sensing data is the scale at which it allows us to observe the world. Instead of studying a single location, satellite imagery enables us to analyse entire cities, countries, or even continents from space. Whether monitoring forests, mapping urban growth, or tracking climate change, much of this work relies on one fundamental data type: raster data.
In this article, I will explain what raster data is, its different types, where it is used, and why it is one of the most important data formats in Geographic Information Systems (GIS) and remote sensing.
What is Raster Data?
Raster data is a way of representing geographic information using a grid of equally sized cells, commonly called pixels.
The cells are arranged in rows and columns, and every cell contains a value representing a specific characteristic of that location. Depending on the dataset, the value may represent: temperature, elevation, land cover, rainfall and pollution concentration
You can think of a raster as a giant spreadsheet laid over the Earth’s surface where every cell stores information about a small piece of the world.
Common examples of raster data include satellite imagery, aerial photographs, digital photographs and scanned maps.
Types of Raster Data
Although all raster datasets are made up of pixels, they represent different kinds of information.
1. Categorical (Discrete) Raster Data
Categorical raster data represents classes or categories rather than measurements. Each pixel belongs to a specific class such as forest, grassland, water body and urban area.
Land cover and land use maps are common examples of categorical raster datasets.
Since each pixel belongs to one category, these datasets typically use integer values.
For example:
| Value | Land Cover |
|---|---|
| 1 | Forest |
| 2 | Water |
| 3 | Urban |
| 4 | Agriculture |
2. Continuous Raster Data
Continuous raster data represents measurements that can take any value within a range.
Unlike categorical data, neighbouring pixels often have similar values that gradually change across space. Examples include temperature, elevation, air pollution, soil moisture and population density.
These datasets usually contain floating-point values, allowing precise measurements.
3. Image Raster Data
Raster data is also used to represent images. Examples include satellite images, scanned historical maps and engineering drawings. Image rasters are primarily designed for visualisation and interpretation.
Common Raster Datasets Used in GIS
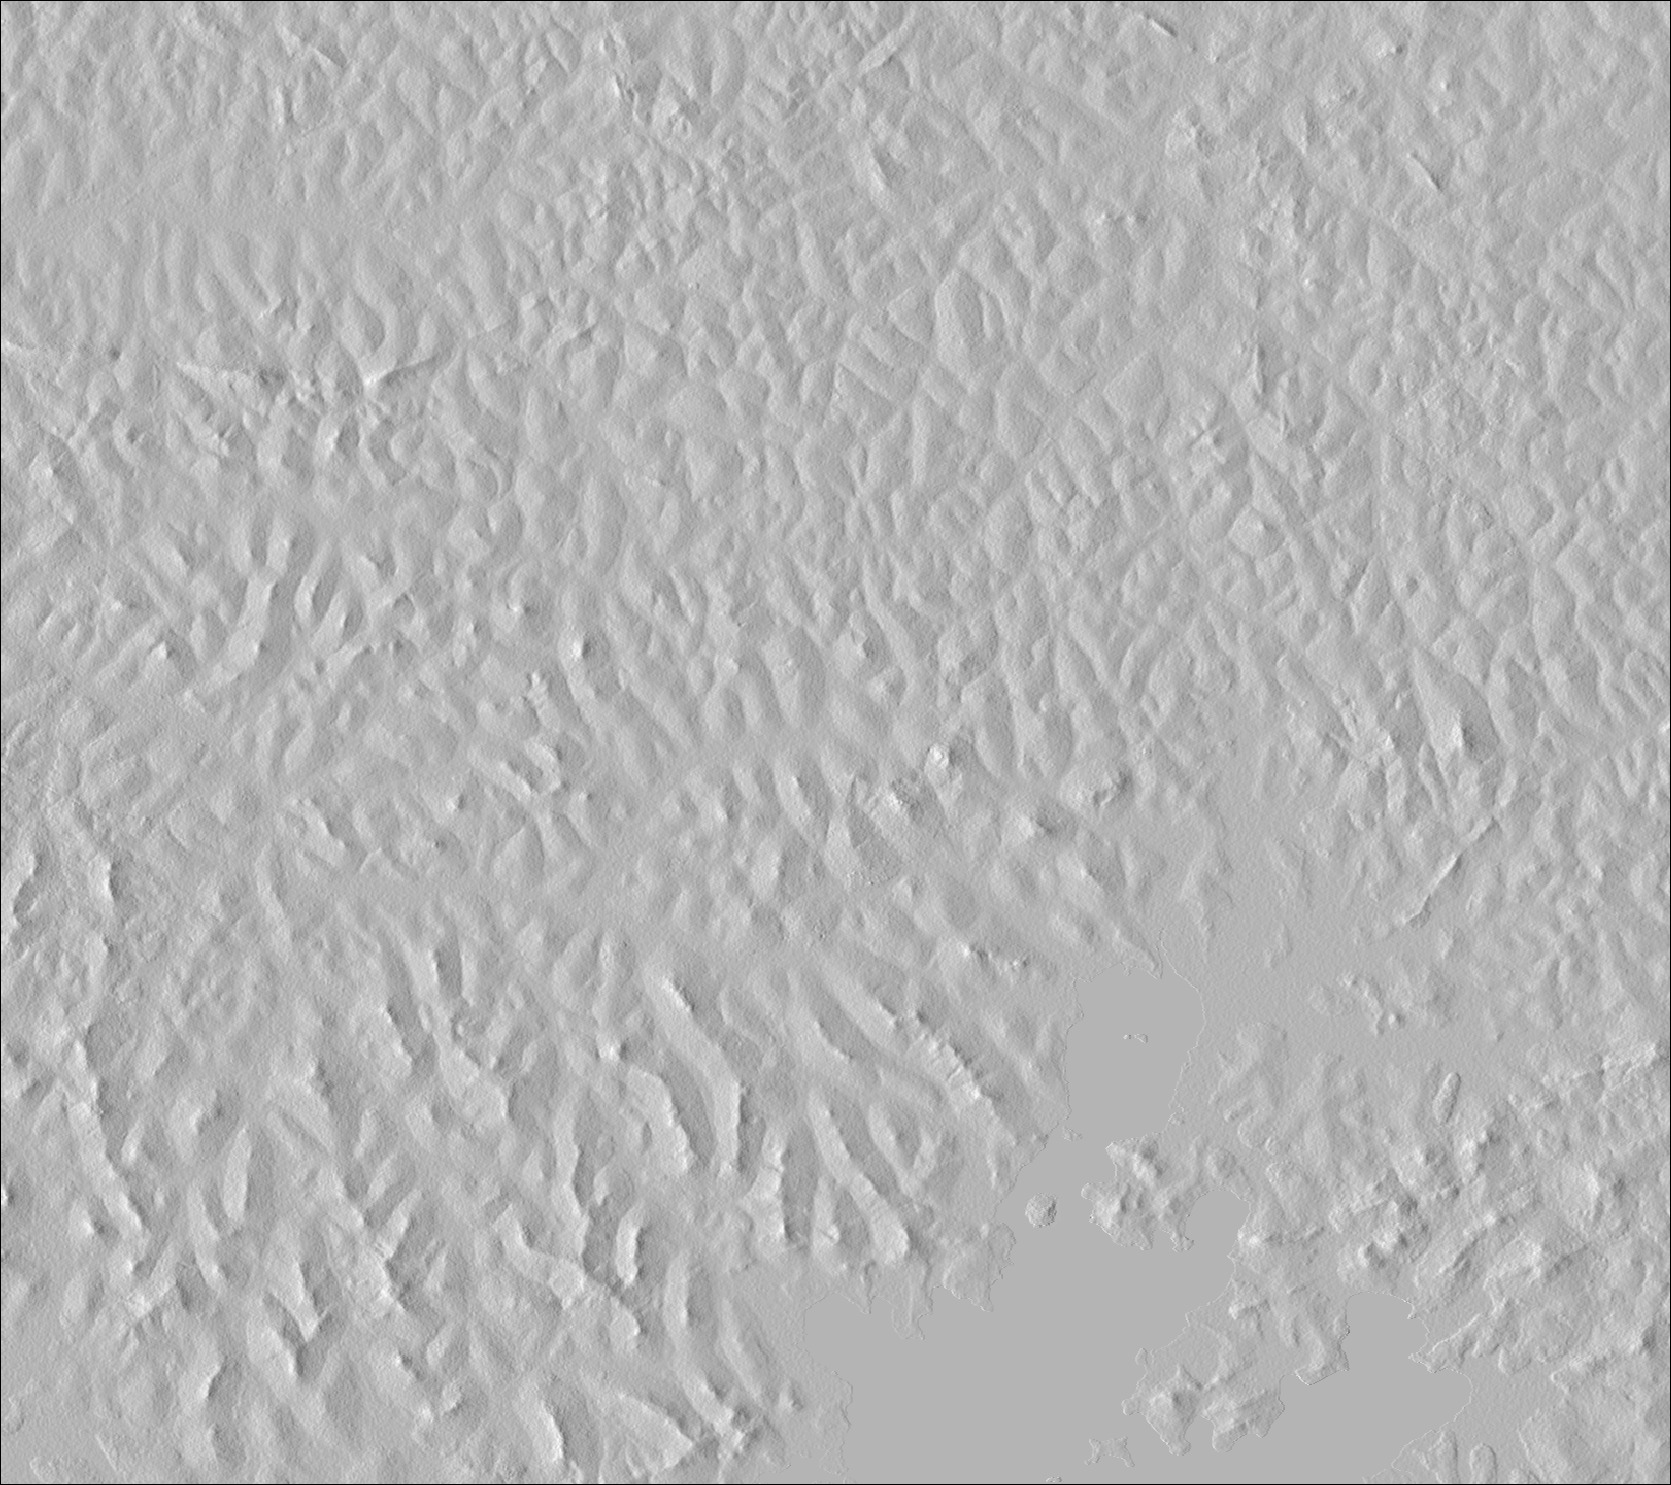
Raster datasets are used across almost every field that relies on geographic information.
Digital Elevation Models (DEMs)
A Digital Elevation Model (DEM) represents the elevation of the Earth’s surface.
Applications include topographic mapping, flood modelling, road planning, land use planning and slope analysis
Temperature Data
Temperature rasters are widely used in climate change studies, agricultural planning, weather forecasting, and natural disaster monitoring.
Satellite Imagery
Satellite imagery is perhaps the most widely used raster dataset.
Applications include forest monitoring, agricultural monitoring, water resource management, urban expansion, mining activities, environmental monitoring, forest fire detection and water quality assessment.
Land Use and Land Cover Maps
These datasets classify how land is being used.
Applications include Urban planning, natural resource management, infrastructure development and environmental conservation
Climate Data
Climate datasets are collected from weather stations and satellites.
They are commonly used for climate change analysis, water resource management, drought monitoring, flood prediction and natural disaster management
How Raster Data is Used
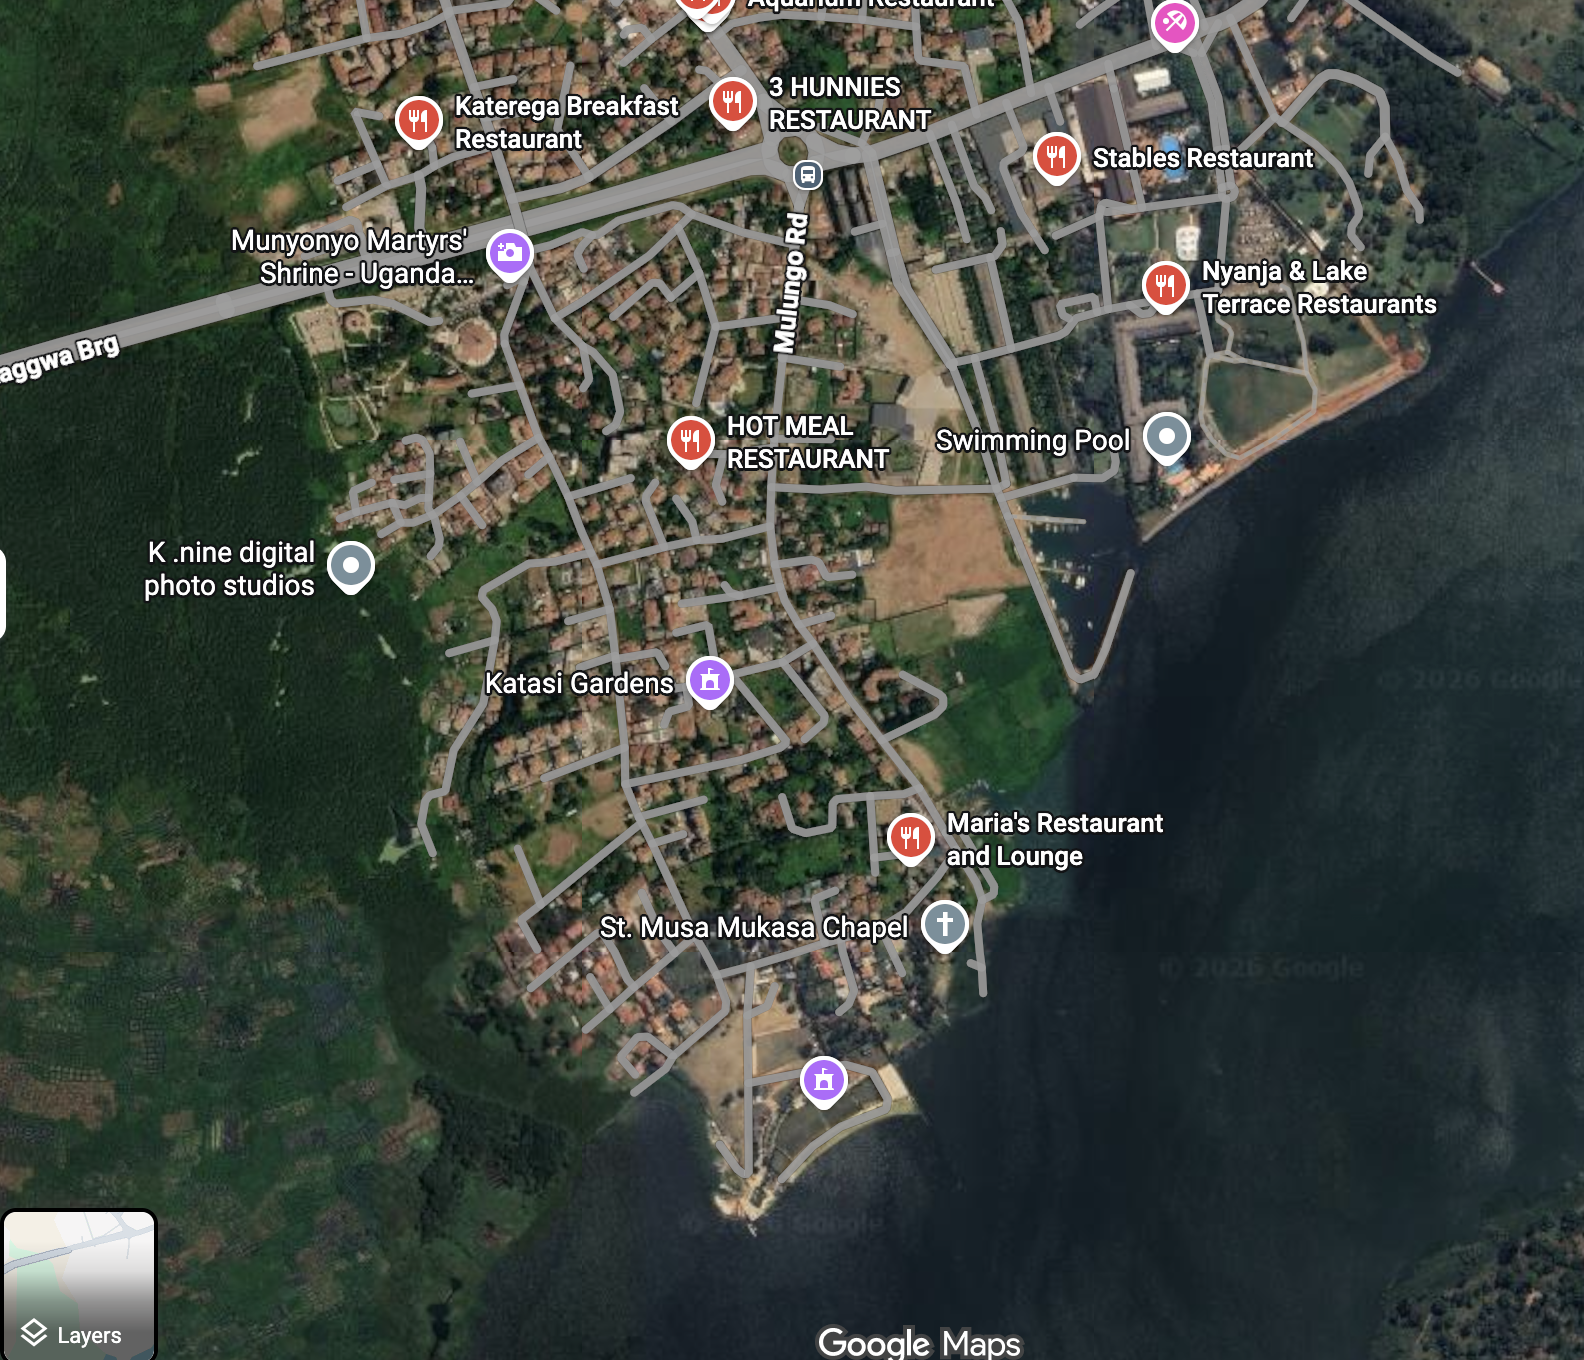
Raster datasets serve different purposes depending on the application.
Raster as Basemaps
Basemaps provide the background upon which other geographic layers are displayed.
Examples of raster data used as basemaps include satellite imagery, aerial photographs and scanned maps
Basemaps help users understand the real-world context behind roads, buildings, rivers, and other map layers.
Raster as Surface Maps
Some geographic phenomena change continuously across space. Raster is ideal for representing these continuous surfaces.
Examples include elevation, temperature, air pollution, population density and rainfall.
Instead of drawing boundaries, surface maps show gradual variation between neighbouring locations.
Raster as Thematic Maps
Raster datasets can also represent specific themes.
A common example is classifying satellite imagery into land cover categories such as forest, water, and cropland. These maps are often produced through image classification and machine learning.
Raster as Attributes of Geographic Features
Raster images can also be attached to geographic features as supporting information.
Examples include building photographs, scanned engineering drawings, historical documents and property images
Why Store Geographic Data as Raster?
Raster has become one of the most widely used spatial data formats because of its many advantages.
Some of the key benefits include:
- Fast overlay operations for complex datasets
- Excellent support for spatial analysis
- Powerful statistical modelling
- Continuous representation of geographic phenomena
- Easy integration with satellite imagery
- Flexible storage of different data types
- Compatibility with most GIS and remote sensing software
Raster is particularly well suited for environmental modelling, machine learning, and image processing.
Georeferencing
A raster image is only useful if we know where it belongs on the Earth’s surface.
This process is called georeferencing.
Georeferencing stores the spatial information required to correctly position a raster on a map.
This information includes:
- Coordinates of the top-left pixel
- Pixel size in the X direction
- Pixel size in the Y direction
- Image rotation (if any)
GIS software uses this information to align the raster with other geographic datasets.
Without georeferencing, a satellite image would simply be a picture with no geographic meaning.
Understanding Resolution
Resolution determines the level of detail contained within a raster dataset.
Two important types are spatial resolution and spectral resolution.
Spatial Resolution
Spatial resolution refers to the ground area represented by each pixel. Every pixel represents a fixed area on the Earth’s surface. For example, imagine a 50 km² area divided into 50 equal cells. Each pixel represents1 km × 1 km. The size of each pixel determines how much detail can be captured. Large pixels produce coarse images with less detail. Small pixels produce detailed images that capture much finer features.
- A 30-meter satellite image can identify large fields and roads.
- A 50-centimetre aerial image can distinguish individual vehicles and rooftops.
Choosing the right cell size depends on the problem you are trying to solve. Higher spatial resolution means:
- Smaller pixels
- More detail
- Better identification of small objects
Lower spatial resolution means:
- Larger pixels
- Less detail
- Faster processing
High-resolution imagery is ideal for mapping buildings, roads, and small agricultural fields, while lower-resolution imagery is often sufficient for studying regional vegetation or climate.
Spectral Resolution
Human eyes can only see three colours: red, green and blue, which are in the visible spectrum. Satellite sensors can detect many additional wavelengths beyond human vision.
These include:
- Near Infrared (NIR)
- Shortwave Infrared (SWIR)
- Thermal Infrared
Images captured using multiple wavelength bands are called multispectral images.
Infrared bands are extremely useful for identifying water bodies, healthy vegetation,burnt areas and crop stress
The number of wavelength bands captured by a sensor is known as its spectral resolution.
A single-band raster is often referred to as a grayscale image, while multispectral datasets contain multiple bands that provide much richer information about the Earth’s surface.
Final Thoughts
Raster data forms the backbone of modern GIS and remote sensing. From satellite imagery and climate modelling to elevation mapping and environmental monitoring, it allows us to represent the world as a continuous surface and perform analyses that would otherwise be impossible.
As machine learning becomes increasingly integrated with geospatial science, understanding raster data is more important than ever. Whether you are building land cover maps, detecting buildings from satellite imagery, estimating crop health, or monitoring air quality, raster data is often the starting point.
In the next article, I will explore vector data and discuss how it complements raster data in GIS workflows.